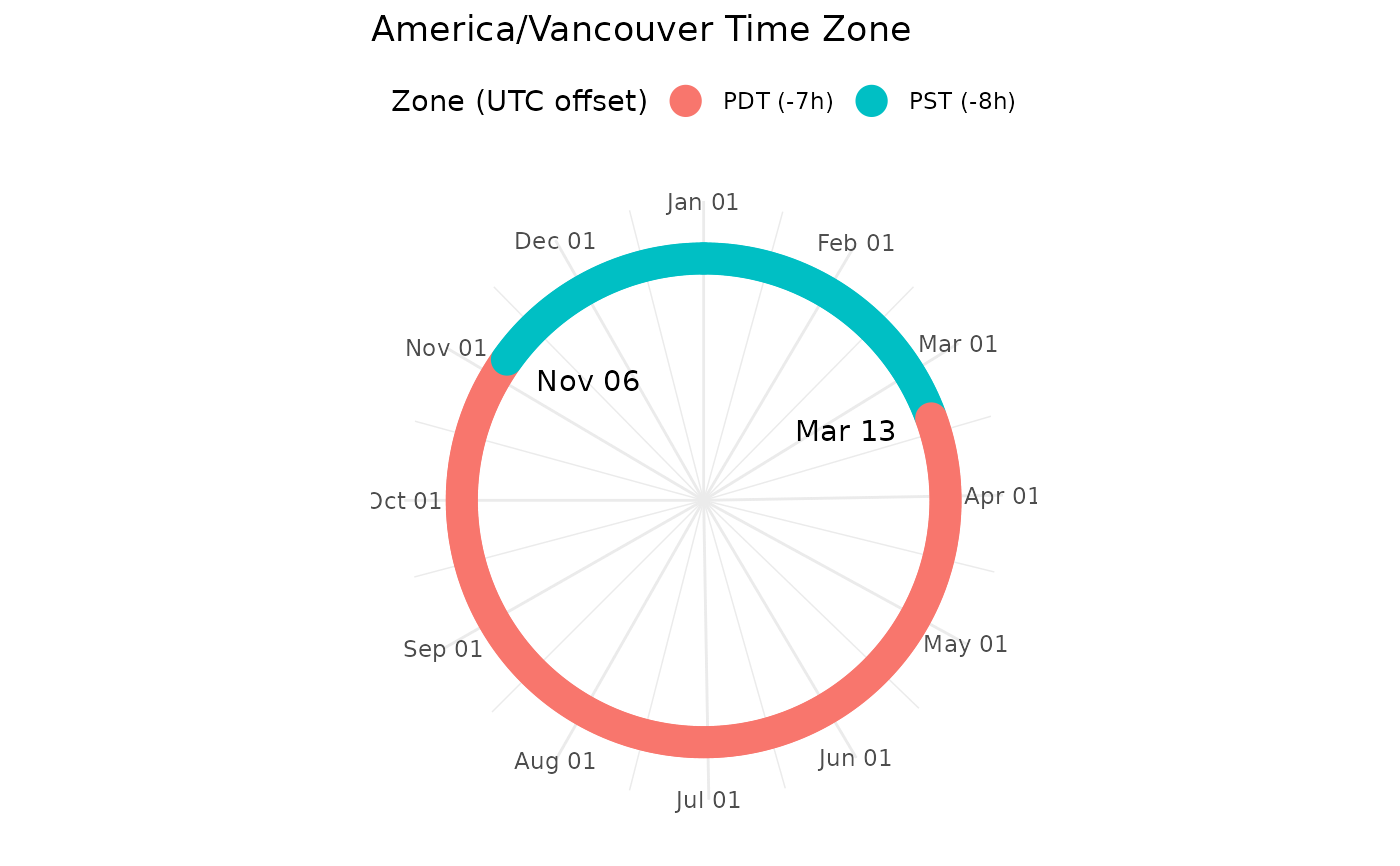
Make a circular plot of a time zone, visualizing the UTC offset over the course of the year, including Daylight Savings times
Arguments
- tz
a valid time zone name. See
OlsonNames()
Make a circular plot of a time zone, visualizing the UTC offset over the course of the year, including Daylight Savings times
a valid time zone name. See OlsonNames()